TAB: Dataset
General
In the tab: Dataset is set how the data of a view is presented in the chart. Therefor it is necessary that a view is created first.
Functionality
Actions
| Action | Description |
|---|---|
| New Line | To add a new line above the selected line. Use the arrow-down key on the last line to add a line underneath the line. Action is only available when Published is unchecked. |
| Delete Line | Deletes the selected line. Action is only available when the field: Published is unchecked. |
| Show OData filter | |
| Translations | To add additional translations for unsupported languages or to deviate from the default caption. |
Fields
| Field | Description |
|---|---|
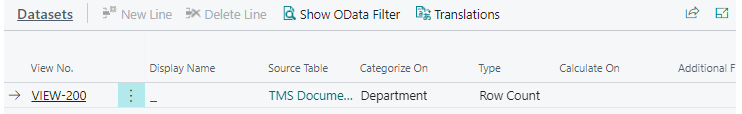
| View No. | The number of the view on which the chart is based. Use the lookup to open the selection page for the views available. |
| Dispaly Name | The name of the view as selected in the field: View No. |
| Source Table | The Table on which the view is based on. |
| Catergorize On | Each chart contains categories. Use the lookup button to open a selection page and select on which field the data has to be categorized. |
| Type | Options: Row Count to show the number of records or Field Sum if a total sum on the values in the field must be made. |
| Calculate On | Click on the lookup button to open a selection page and select the field on which the function as selected in the field: Type has to be performed. |
| Additional Filter On | Click on the lookup button to open a selection page and select a field on which a filter must be added. |
| Additional Filter Value On | Enter a filter value, to be applied on the field: Additional Filter On. |
| Published | Is the view or chart available on the 3PL Web Portal. |