Performance Profiler
General
In v25 Microsoft has introduced the Performance Profiler. With this functionality, a consultant and/or key-user can investigate whether a specific cause can be identified for performance problems.
For more information on the functionality see: Microsoft Learn
Functionality
The performance profiler has 2 options:
Standard Performance Profiler
A customer has experienced that the execution of creating and posting invoice takes longer than normal. The following steps have to be performed:
1. Prepare process
Start the 3PL Dynamics web-client and complete the normal business process until the moment moment of invoices to be created.
2. Open Performance Profiler
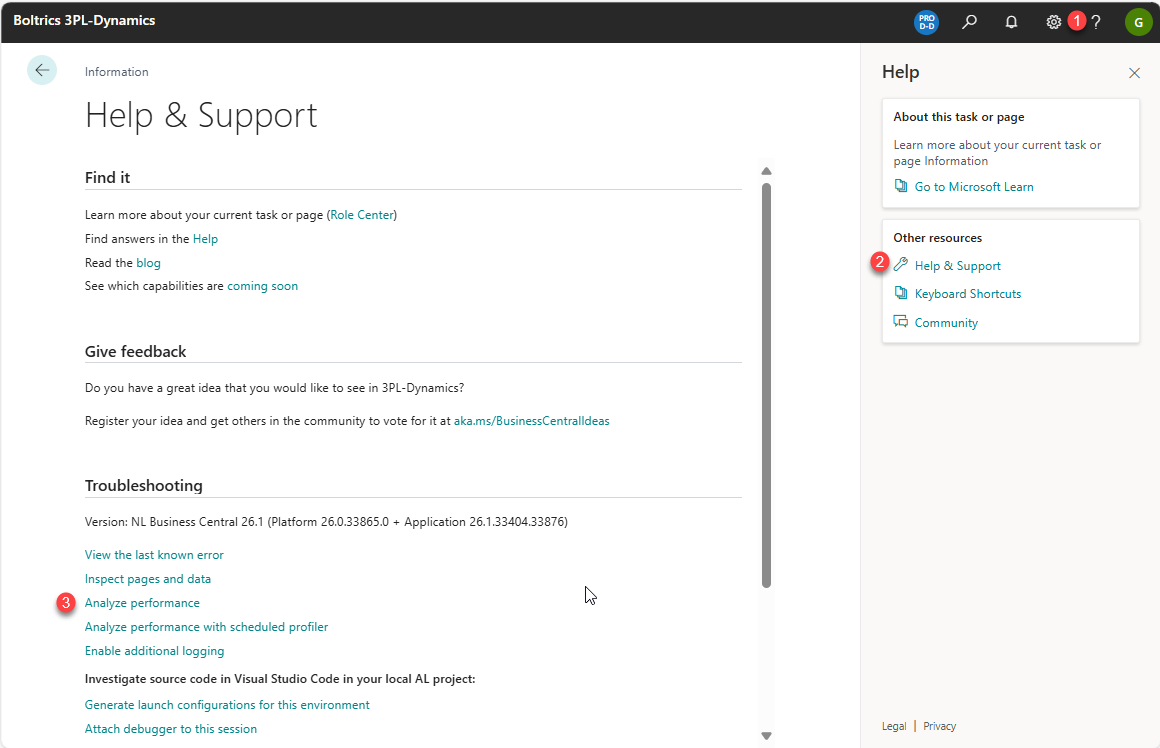
- Start the help menu by clicking on the help button:
 .
. - Select the option: Help & Support.
- Go to the paragraph: Troubleshooting and Select the option: Analyze Performance. A new window: Performance Profiler will be opened.
3. Start Performance Profiler
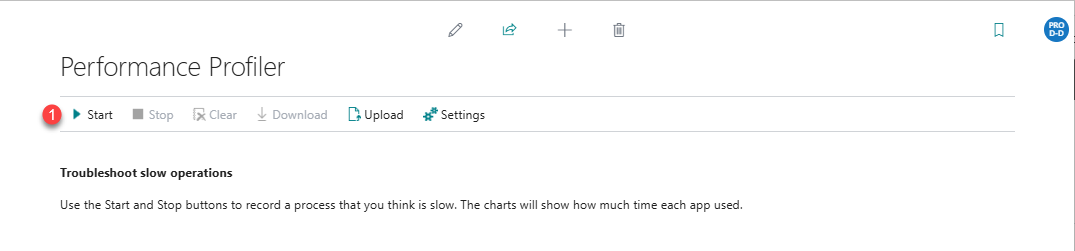
- Click on the action: Start to start the Performace Profiler and monitor all actions performed in the webclient.
3. Perform Business process
- Return to the 3PL Dynamics web-client.
- Execute the normal business process.
4. Stop Performance
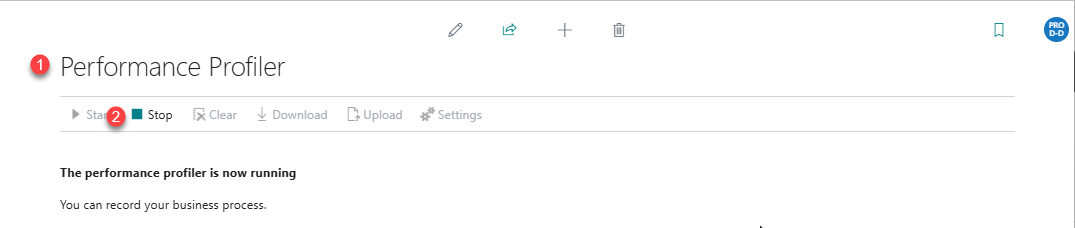
- Return to the window in which the Performance Profiler was started.
- Click on the action: Stop to end the Performance Profiler.
5. Analyze usage per APP
The graphs on the tab: Performance Profiler and Time Spent shows the usage per APP, required to handle the process.
As the following example shows The Microsoft Base Application APP requires the most time.
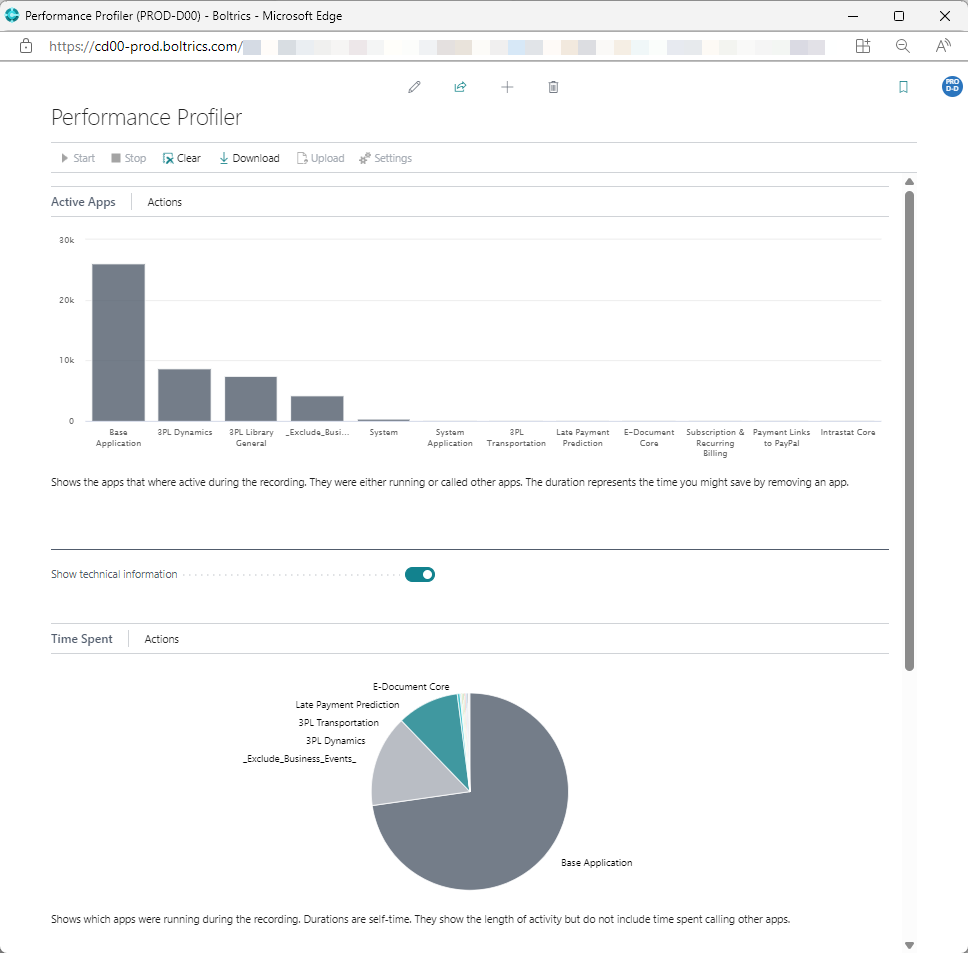
Tip
Switch the button: Show technical information to: on to present the pie-graph.
6. Analyze detailed info
The Tab: Time spent by Application Object shows what time each object requires to perform the process. As this overview is sorted on Timme Spent the objects requiring the most time will be listed at the top, as shown in the expample below.
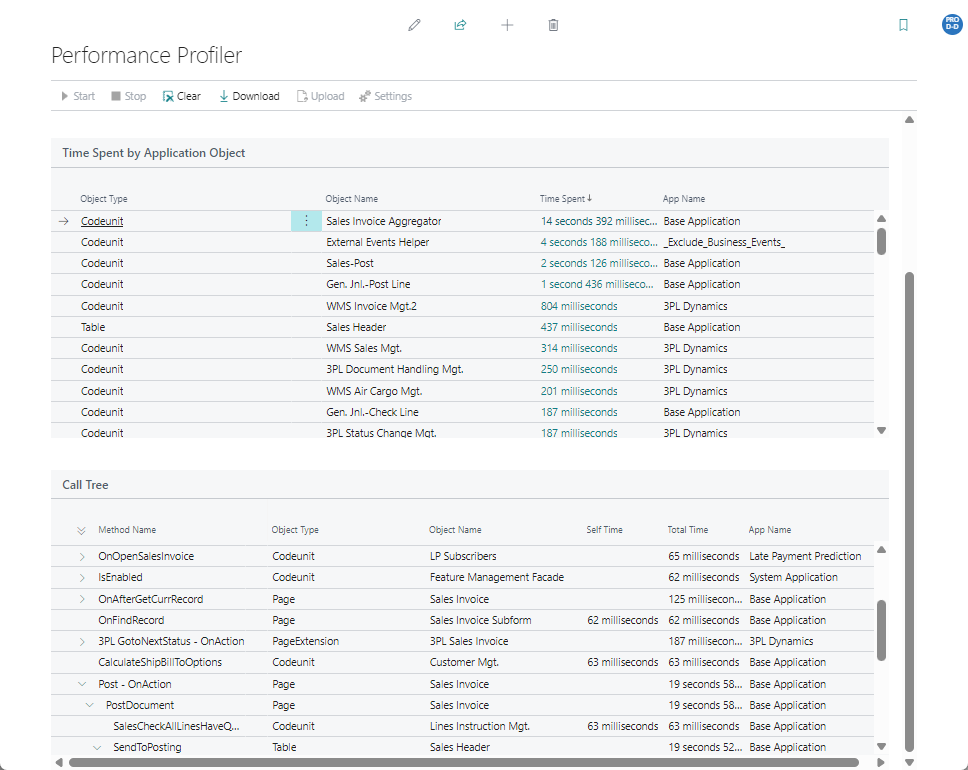
Tip
Click on the expand-button at the beginning of a row to see more details on the process.
The results show that the Posting of the invoice is causing the long duration. The business-process has been repeated once more with a similar order. As shown in the example below the Post-action now only required 1 second in stead of 19 seconds.
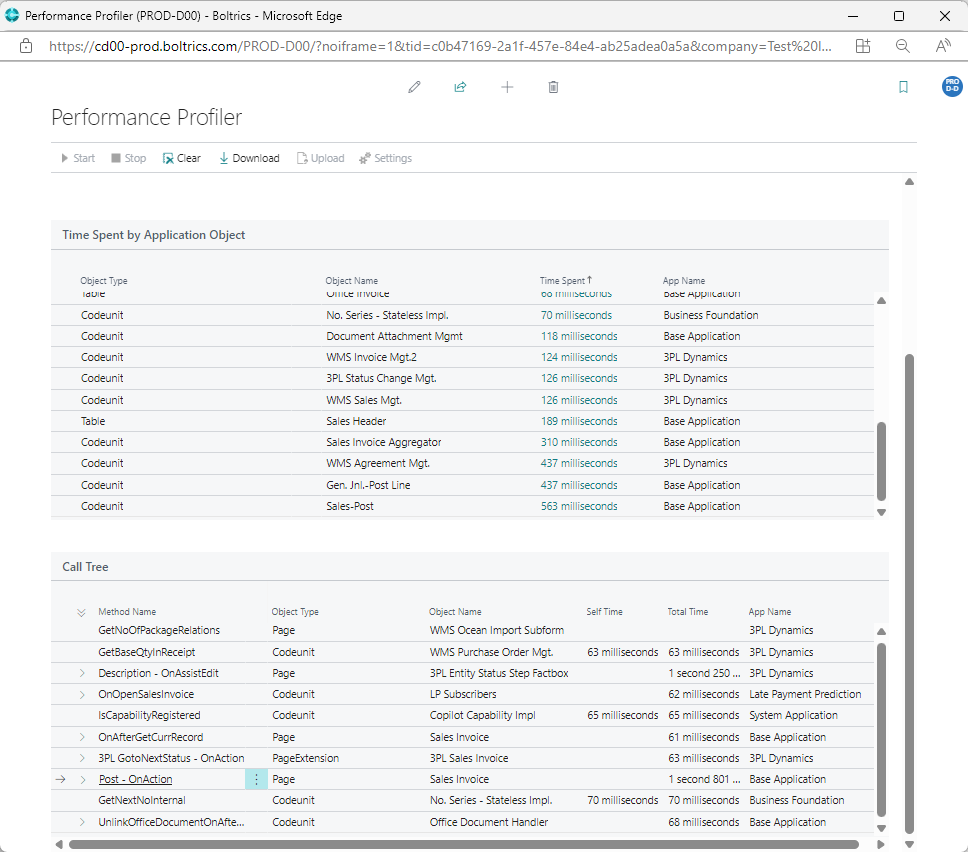
Conclusion is that the duration of the execution of the process varies a lot. An other process must be influencing the process of posting the invoice at the specific date/time.
Other processes that may cause the delay in performance:
- Is a colleague performing a job at the specific time, which requires a lot of performance?
- Is a specific taks in the jobqueue running at the specific time.
- Is an API running at the specific time. For example for an data-integration or Business Annalysis tool.
- Is the latest application version of Business Central Dynamics running?
Scheduled Performance Profiler
A customer has experienced that the response time on scanners is longer than normal. By planning a scheduled Performance Profiler the task can be planned on a specific time and be executed over a longer time for example 1 or 2 hours. The following steps have to be performed:
1. Open Performance Profiler
- Start the help menu by clicking on the help button:
- Select the option: Help & Support
- Go to the paragraph: Troubleshooting and Select the option: Analyze Performance with scheduled profiler A new window: Profiler Schedule will be opened.
3. Start Performance Profiler
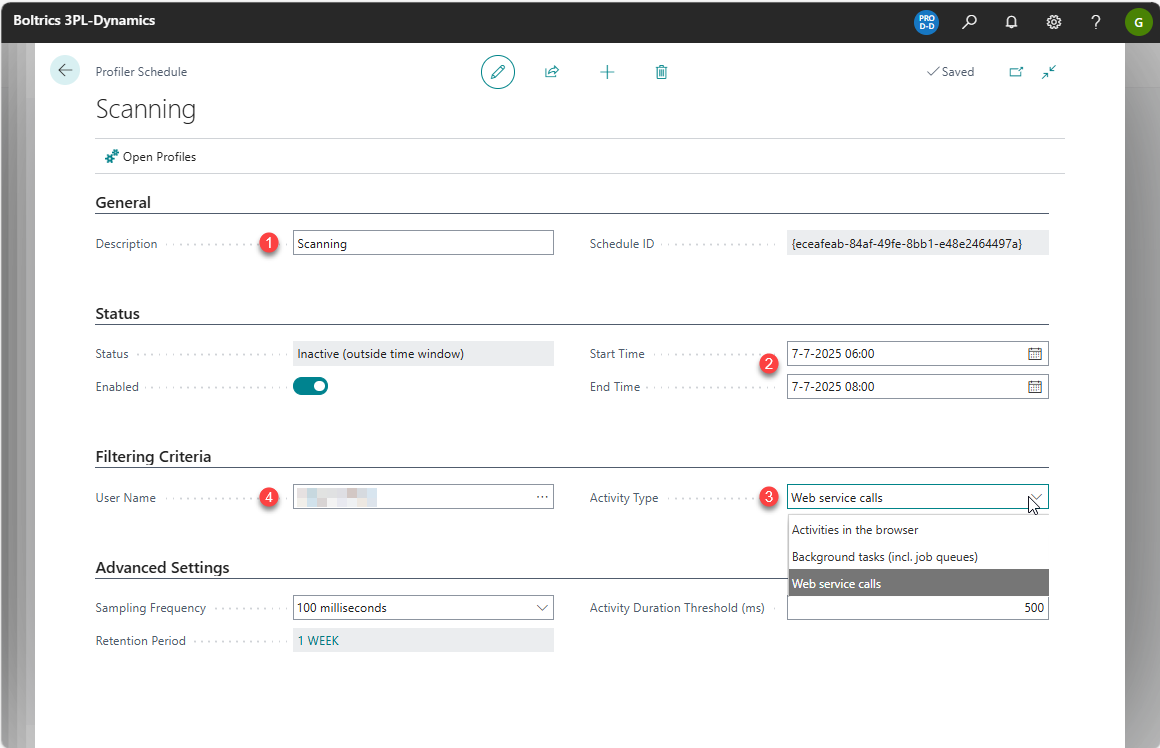
- Enter a description for the recording
- Enter a start date/time and ending date/time
- Select a Activity Type:
- Activity in browser, to monitor a specific user performing a proces in a Web Browser/Client.
- Background task(incl. job queues), to monitor a background task from a user or job Queue.
- Web Service calls, to monitor a webservice for example scanners.
- Select a user depending on the type selected in Activity the following options:
- Username, to monitor a specific user in a Web Client or a Job Queue started by the specific user.
- Webservice calls, select BOLTRICS APP PLATFORM to monitor the traffic on webservice communicating with web-scanners or BOLTRICS Telnet Proxy for communicating with Telnet-scanners.
Note
Logging is done per user. If multiple users are involved, you need to create multiple profiler schedules per user.
4. Perform Business process
During the date-times mentioned in the Performance Profiler monitoring will start automatically.
5. Analyze usage per APP
The same procedure as in the Standard Performance Profiler.
6. Analyze detailed info
The same procedure as in the Standard Performance Profiler.