DataHub Error Analysis Guide
Overview
When you receive an error notification by email from DataHub, this guide will help you analyze and troubleshoot the issue directly within the DataHub interface. Understanding how to navigate and interpret error information is crucial for maintaining smooth data integration processes.
Prerequisites
- Access to DataHub interface
- Error notification email with Flow ID and Run ID
- Basic understanding of your integration flows
- If you miss this understanding, you are always welcome to join one of our DataIntegration Q&A sessions. Please schedule an appointment through our Boltrics Academy: https://boltrics.sharepoint.com/sites/BoltricsAcademy.aspx (see Events section)
Step-by-Step Error Analysis Process
Your Error Email
When you receive an error notification from DataHub, the email contains three main sections that provide crucial information for troubleshooting:
1. Error Message (Primary Issue)
This is the actual error from the originating system or action. Sometimes this will immediately explain the issue and provide resolution steps. The error message consists of three main parts:
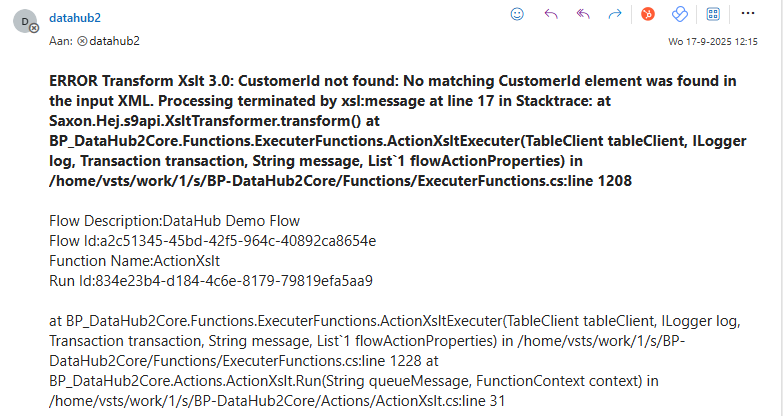
Part 1: Error Details Example:
ERROR Transform Xslt 3.0: CustomerId not found: No matching CustomerId element was found in the input XML.
Processing terminated by xsl:message at line 17 etc..
Part 2: Flow Information (Context Details) This section includes metadata about the flow, run, and function where the error occurred. Use these identifiers to locate the specific issue in DataHub.
Example:
Flow Description:DataHub Demo Flow
Flow Id:a2c51345-45bd-42f5-964c-40892ca8654e
Function Name:ActionXslt
Run Id:834e23b4-d184-4c6e-8179-79819efa5aa9
What to use:
- Flow ID: Primary identifier to locate the flow in DataHub
- Run ID: Specific execution instance that failed
- Flow Description: Human-readable name for easier identification
- Function Name: Specific component that encountered the error
Part 3: Technical Stack Trace (Debug Information) This section contains the detailed call stack that shows the execution path when the error occurred. This information is valuable when forwarding the issue to support teams.
Example:
t BP_DataHub2Core.Functions.ExecuterFunctions.ActionXsltExecuter(TableClient tableClient, ILogger log, Transaction transaction, String message, List`1 flowActionProperties) in /home/vsts/work/1/s/BP-DataHub2Core/Functions/ExecuterFunctions.cs:line 1228
Note: The stack trace helps developers understand the exact execution path and can reveal underlying system issues beyond the surface error message.
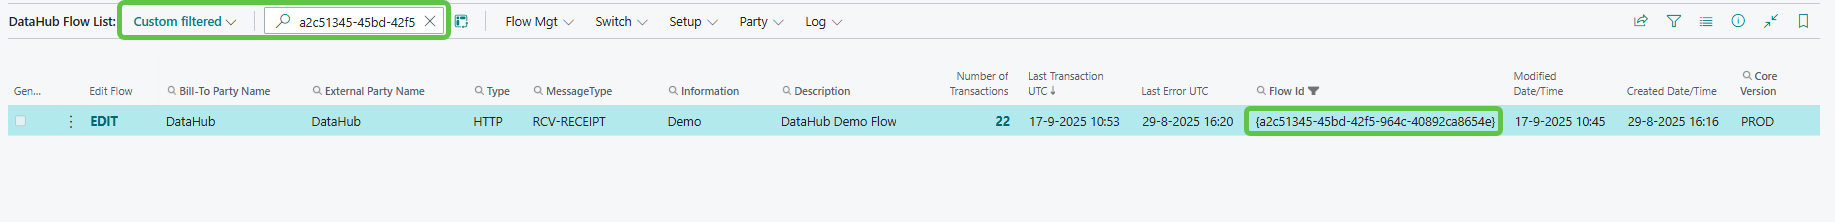
2. Navigate to the DataHub Flow List
- Action: Open DataHub -> navigate to DataHub Flow List
- Purpose: This provides an overview of all configured integration flows
- Location: Usually found in the main navigation menu alt+q -> 'DataHub Flow List'
3. Locate the Relevant Flow
- Method 1: Use the Flow ID from the error message
- Method 2: Use the Flow Description if Flow ID is not available
- Filtering: Use the search/filter functionality to quickly locate the specific flow
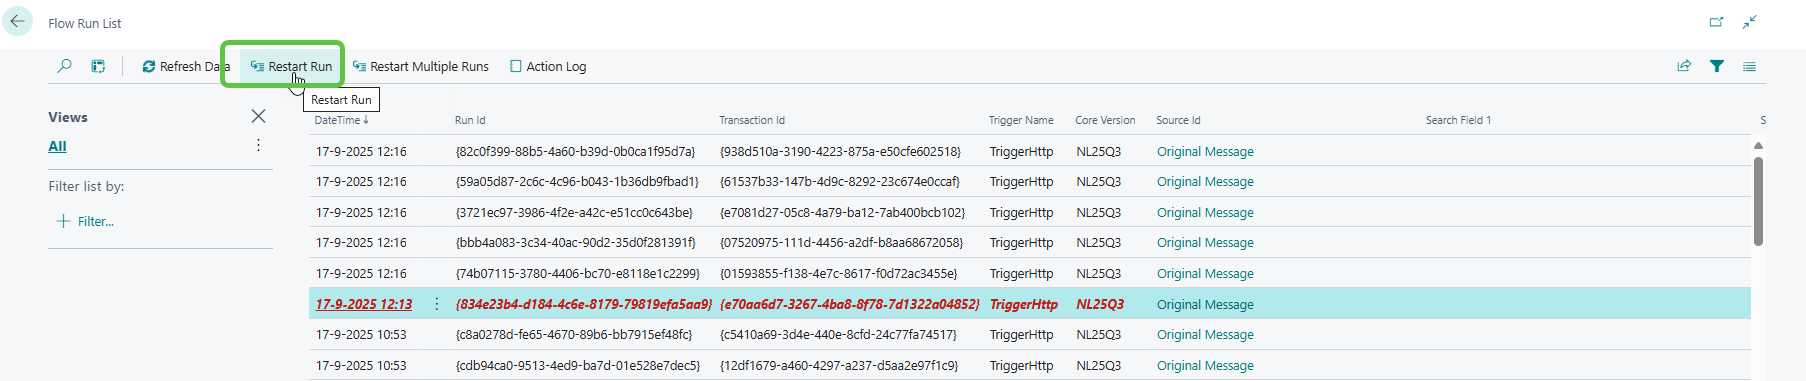
- Visual Indicators: If the error took place on the same day, the flow field 'Last Error UTC' will be highlighted in red
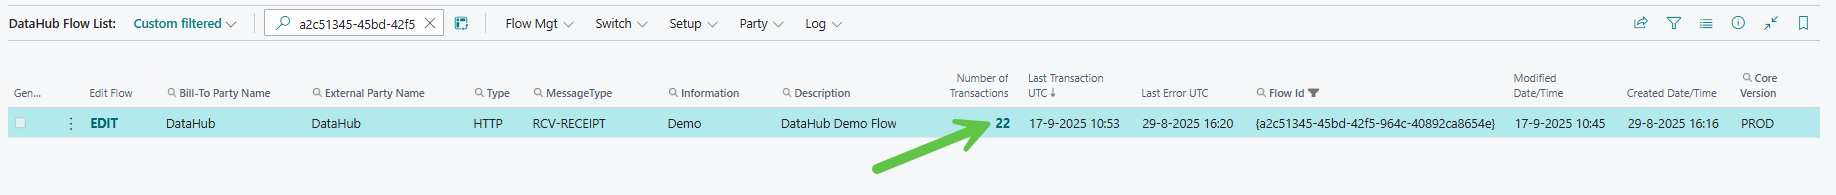
4. Open the Run List
- Action: Click on the Number of Transactions for the identified flow
- Result: This opens a detailed list of all execution runs for that flow
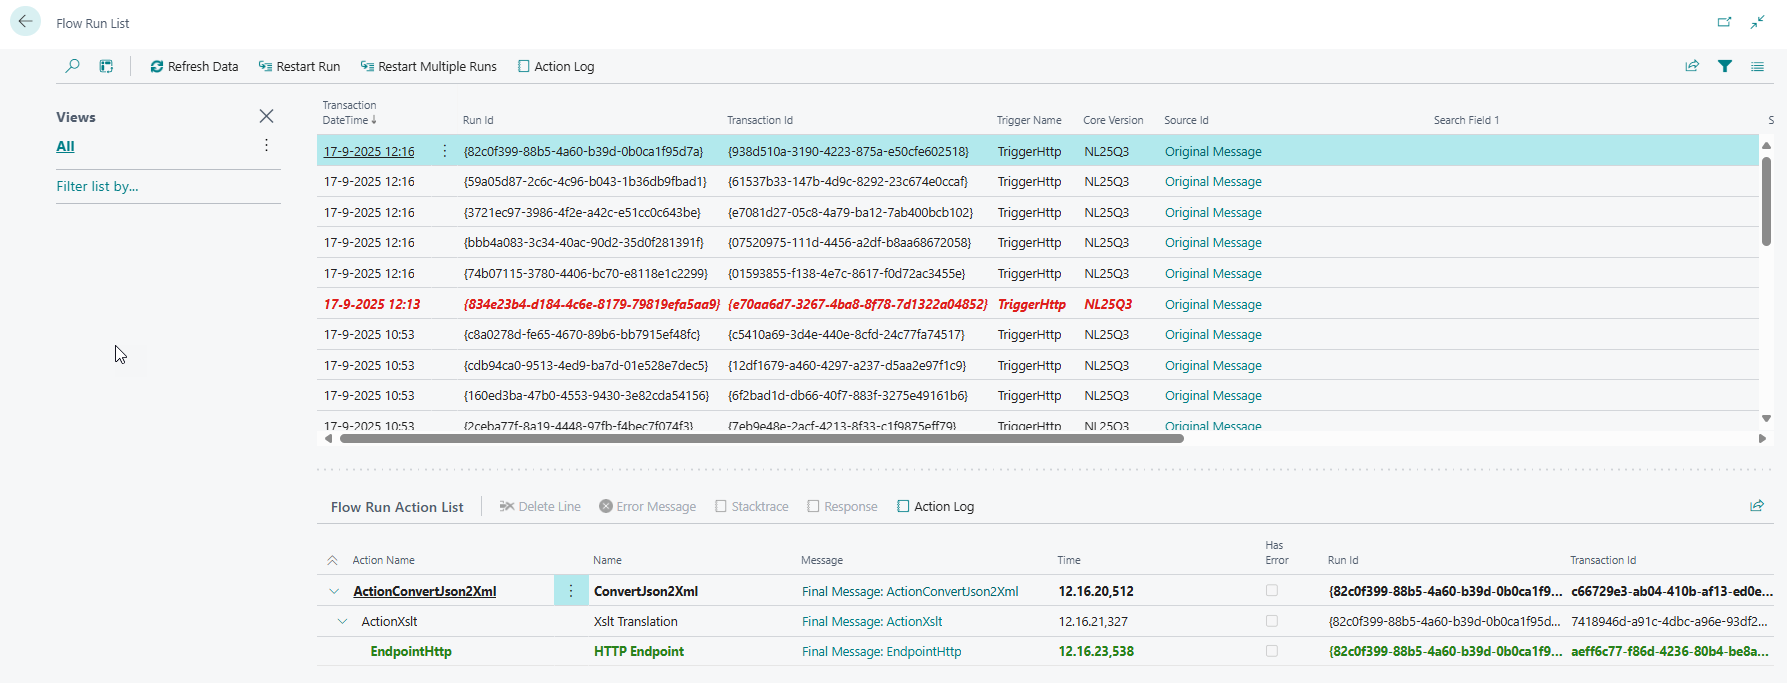
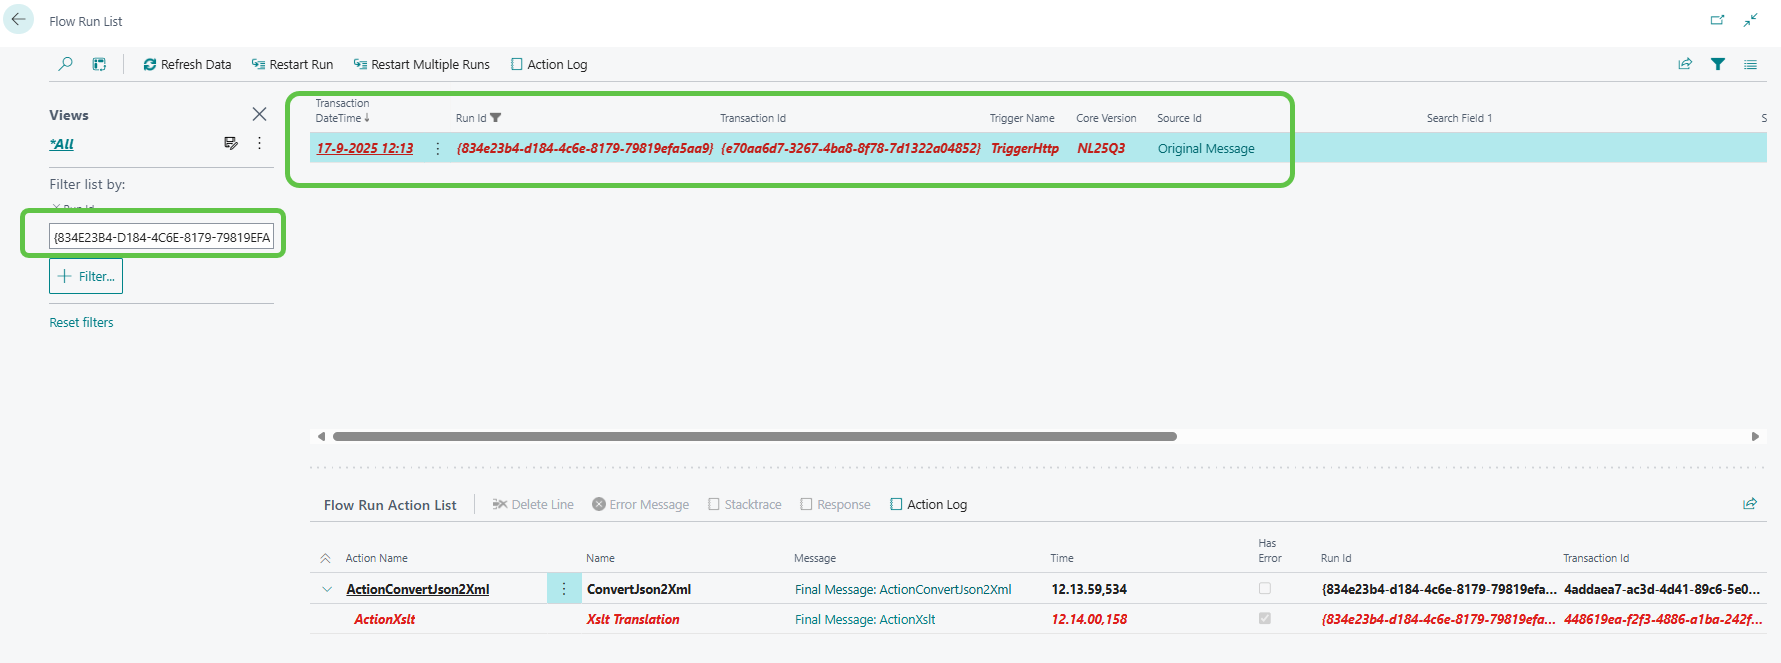
5. Identify Failed Transactions
- Visual Indicators: Failed runs are highlighted in red
- Filtering: Use the Run ID provided in the error email to locate the exact failed transaction
- Additional Filters: You can also filter on other fields if needed
📚 Related Documentation: For detailed information about transaction steps and data flow, see DataHubTransactions.md
6. Analyze and Find Error Details
Each step is visible as described in DataHubTransactions.md
To find the step where the error occurred, select the line in the Flow Run Action list that is highlighted in red and click on 'Error Message' for the error details and 'Stack Trace' to see the trace
For each step, you can download the EDI message data showing how it was at that time for the specific action in its converted/transformed state
If the error takes place in the last action step to an endpoint, you can also click on 'Response' which will contain the response sent from the regarding service
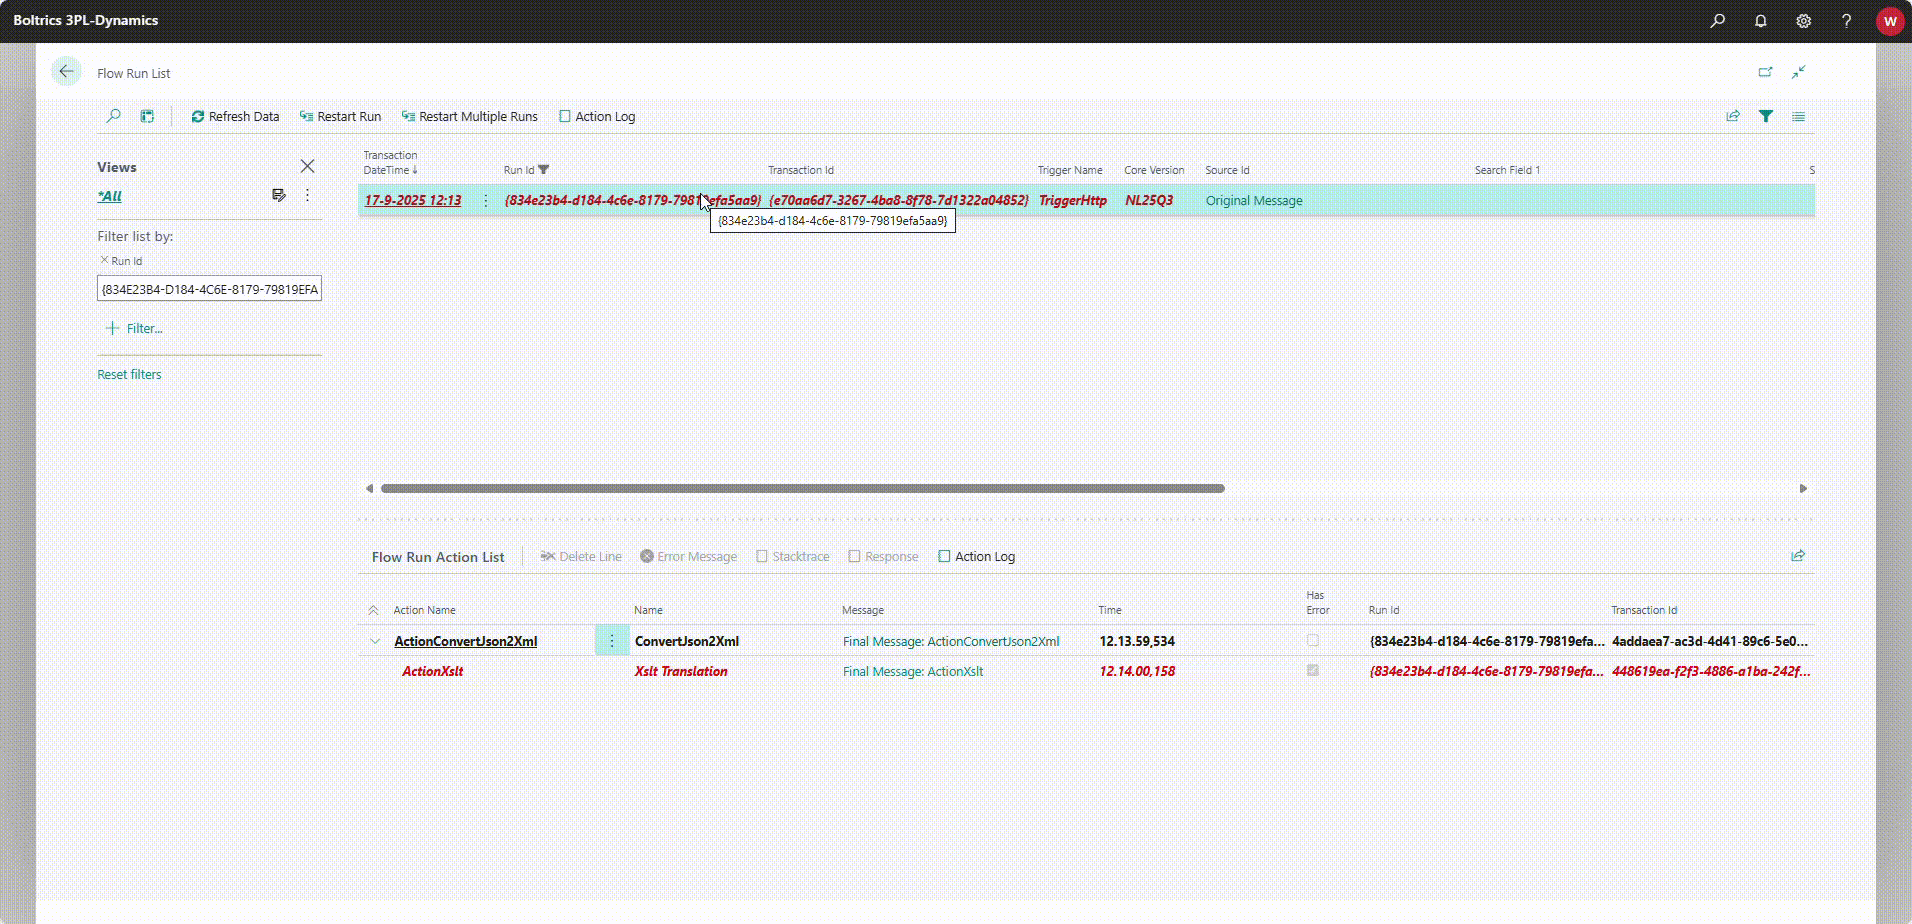
All of this information will ensure you can find and analyze the error root cause yourself without waiting for support.
7. Analyze Error Root Cause
Data-Related Issues:
- Missing required fields
- Invalid data formats
- Data validation failures
- Character encoding problems
Configuration Issues:
- Incorrect mapping settings
- Missing credentials
- Invalid endpoint URLs
- Expired authentication tokens
External System Issues:
- Target system unavailable
- Network connectivity problems
- API rate limiting
- Third-party service errors (e.g., Atlas)
8. Take Appropriate Action
⚠️ Important: Before taking action, if you have analyzed the error and determined that it is due to a temporary service disturbance, you can easily restart the transaction by clicking on 'Restart Run' for the selected transaction. You can also select multiple transactions and then click on 'Restart Multiple Transactions'.
For Data Issues:
- Correct the source data in your system
- Validate data format before sending
- Check for special characters or encoding issues
- Resend the corrected message
For Configuration Issues:
- Review flow settings and mappings
- Update credentials if expired
- Verify endpoint configurations
- Test the flow with a small dataset
For External System Issues:
- Check system status of target applications
- Verify network connectivity
- Contact external system administrators
- Wait for service restoration
9. Escalation Process
If the error persists or is outside your control:
- Document: Collect all relevant error details
- Include: Flow ID, Run ID, error message, and scenario description
- Attach: Screenshots and error logs if possible
- Contact: For further assistance, refer to the Support page for guidance on how to reach the support team.
Common Error Scenarios and Solutions
Scenario 1: Data Validation Errors / Mapping Issues
Symptoms: Fields marked as required are missing Solution: Review source data completeness
Scenario 2: Authentication Failures
Symptoms: 401/403 error codes Solution: Refresh API keys or credentials, verify permissions
Scenario 3: Network Timeouts
Symptoms: Connection timeout errors Solution: Check network stability of the related system. Is it up and running?